
Code Coverage for microchip MpLab IDE
In this 3mins video, you will see how to generate code coverage for embedded applications in microchip MpLab IDE using RKTracer Tool with 3 simple steps.
- Enable the RKTracer tool and rebuild the application.
- Test instrumented application and save coverage data.
- Generate code coverage reports

Code Coverage tool integration with MpLab IDE
1: Ensure you have only one instance of MpLab IDE opened.
go to Tools–> Plugins Download and Go to MPLab X Plugin Manager

2: Open Code Composer Studio IDE . The RKTracer tool options will be in External tools and by default, in
Select Downloaded tab→ Add Plugin and select RKTracer tool plugin “com-rkvalidate-nb.nbm” for MpLab IDE from the RKTracer tool installation folder
C:\rktracer\share\rktracer-plugins
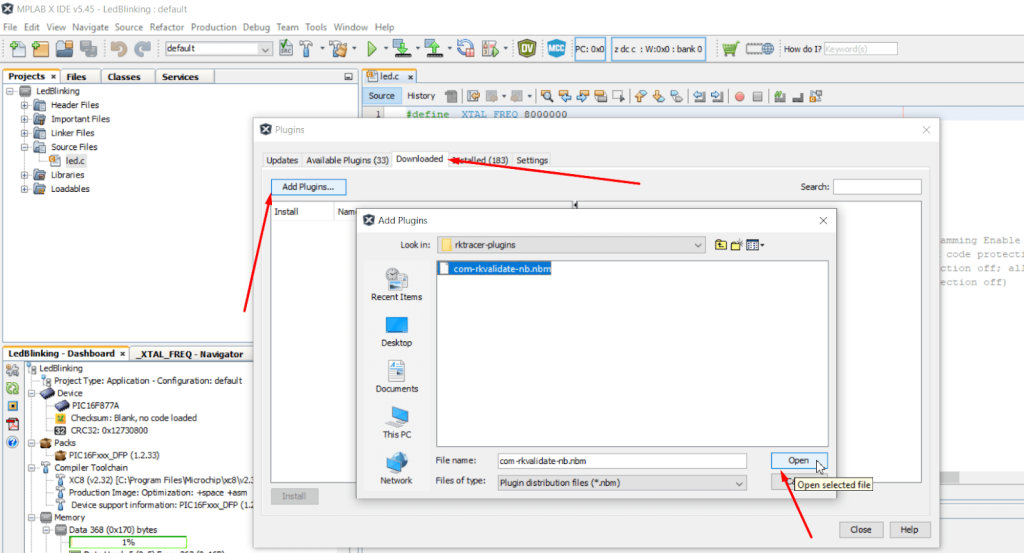
Install the RKTracer Plugin by following the instructions.

2: Restart the MpLab IDE, and you should be able to see the RKTracer tool options in the Tools menu.
- RKTracer ON: Will enable RKTracer tool for instrumentation
- RKTracer OFF: Will disable RKTracer tool.
- RKTracer Reports: Will generate reports in HTML format.

Generate Code Coverage for Embedded Application in Code Composer Studio IDE.
Prerequisites: Once you have successfully integrated the RKTracer tool. At least once you need to build and test the application in embedded target in debug mode and restart the IDE.
Enable Code Coverage Tool
- RKTracer ON: Will enable RKTracer tool for instrumentation
- RKTracer OFF: Will disable RKTracer tool.
- RKTracer Reports: Will generate reports in HTML format.
Go to → Tools → RKTracer ON. When you enable RKTracer Tool for the first time. You will see a popup message to click ok so that the RKTracer tool will be turned ON.

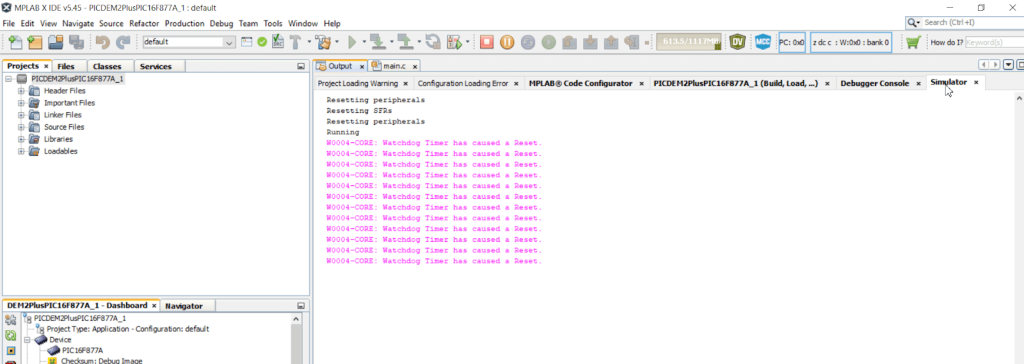
Rebuild application and run tests
Automatically coverage data will be saved when you terminate debug process after running the test case on the embedded target. Once testing is complete, the RKTracer tool will save the coverage data to the RK_MEM.raw file in the application working folder.
In case the embedded target is not connected to the host machine at the testing. You need to save coverage data from the rktracer variable to the application working folder in the host machine using api.
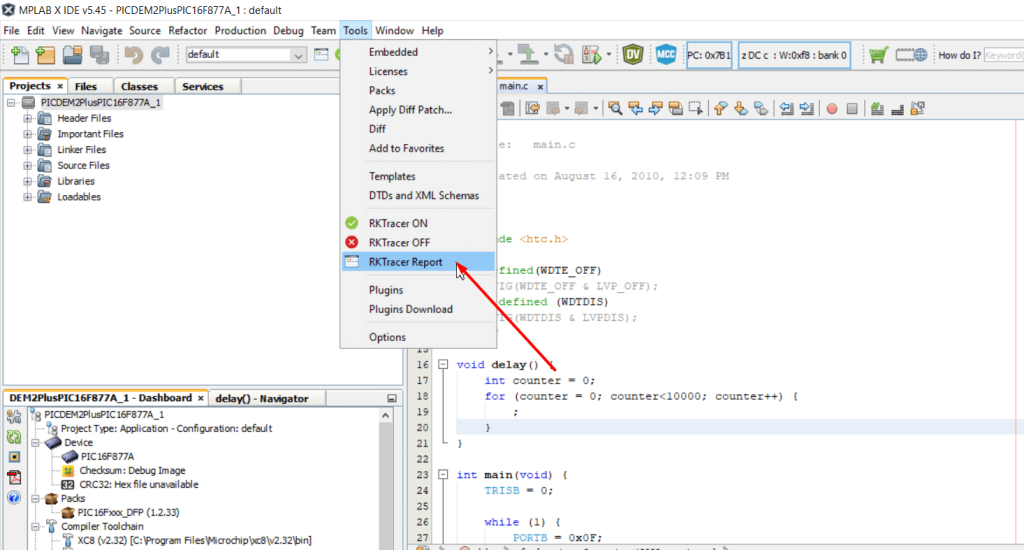
Generate Code Coverage Reports.
Go to –> Tools –> RKTracer Report to generate Html reports. The RKTracer tool will internally convert the RK_MEM.raw data file to “rk-coverage.txt” and map with JSON files (generated during instrumentation) in the rktracer folder and generate the HTML reports. You can manually open the HTML report using index.html.
If embedded target is not connected to host ,then contact support. We will provide customized script to transfer coverage data from embedded target to host machine.
RKTracer Html code coverage landing page.
Enable coverage for selected files
Generate coverage reports for the selected folders
C:projectsounddriversbasepower
C:projectsounddriversbasepowerfirmware_loader
C:projectsounddriverscore
C:projectsoundsecuritykeys
C:projectsoundsecuritylockdown
Suppose you need code coverage for source files from three different folders, i.e., core, keys, power, and ignore coverage for folders firmware_loader and lockdown. Edit rktracer.config in the RKTracer installation folder and go to the end of the file add the following information.
ignore *.c
instrument */power/* */core/* */keys/*
never */firmware_loader/* */lockdown/*
ignore *.c = Ignores all C source files from instrumentation
Instrument = Instrument source files from given folders
never = ignore selected folder
Generate coverage reports only for selected functions from three different files.
fun_X() in source-file-X
fun_Y() in source-file-Y
fun_Z() in source-file-Z
Suppose you need code coverage for selected functions from three different files. Edit rktracer.config in the RKTracer installation folder and go to the end of the file and set the following variables as shown below.
ignore *.c
instrument *source-file-X.c *source-file-Y.c *source-file-Z.c
function-ignore *
function-instrument fun_X() fun_Y() fun_Z()
ignore *.c = Ignore all C programming source files
instrument *file-X.c *file-Y.c *file-Z.c = Instrument only these three source files.
function-ignore * = Then ignore all functions in the above three files.
function-instrument fun_X() fun_Y() fun_Z() = Don’t ignore these three functions from these three files from instrumentation