
Code Coverage for Android Apps in Android Studio IDE
In this 5mins video, you will see how to generate code coverage for android apps in android studio ide using RKTracer Tool with 3 simple steps.
- Enable the RKTracer tool and rebuild the application.
- Test instrumented application and save coverage data.
- Generate code coverage reports
Code Coverage tool integration with Android Studio IDE
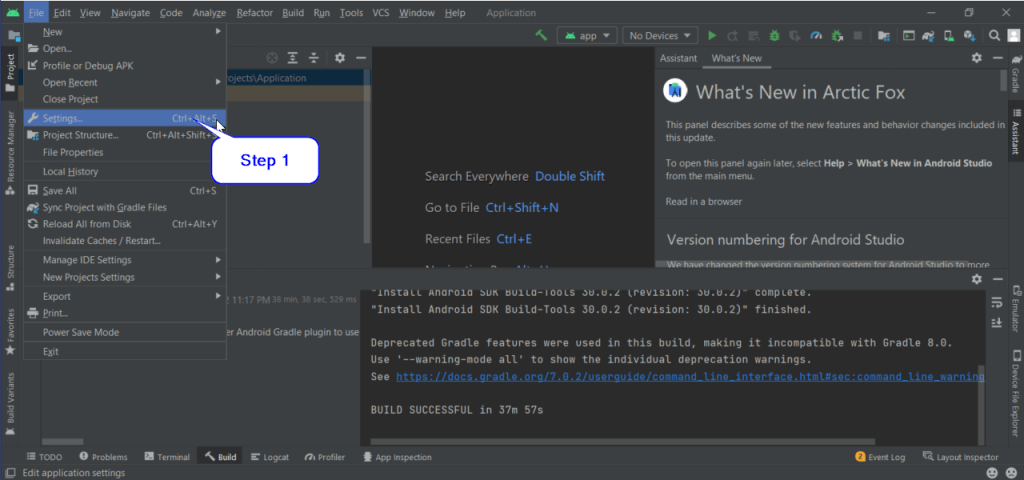
1: Open Android Studio IDE.
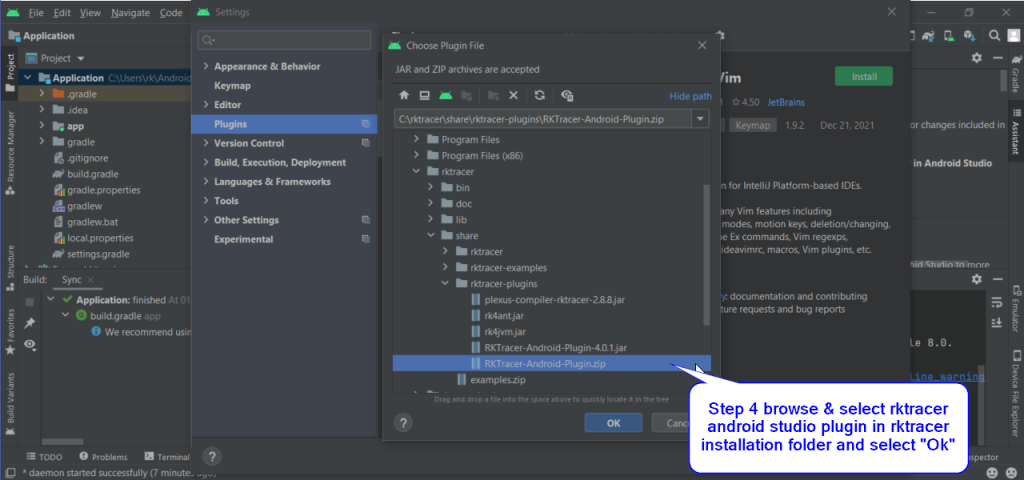
2: Go to the File menu→ Settings → Plugin on the left side of the screen and then on the right side, click the “setting” icon on the right side and select the “install plug-in from disk” option.

3: Navigate to the RKTracer tool installation folder,
Windows: “C:\rktracer\share\rktracer-plugins”
Linux: “/home/username/rktracer/share/rktracer-plugins”
Select “RKTracer-Android-Plugin.jar” and select ok, to install the RKTracer plugin for Android Studio IDE.
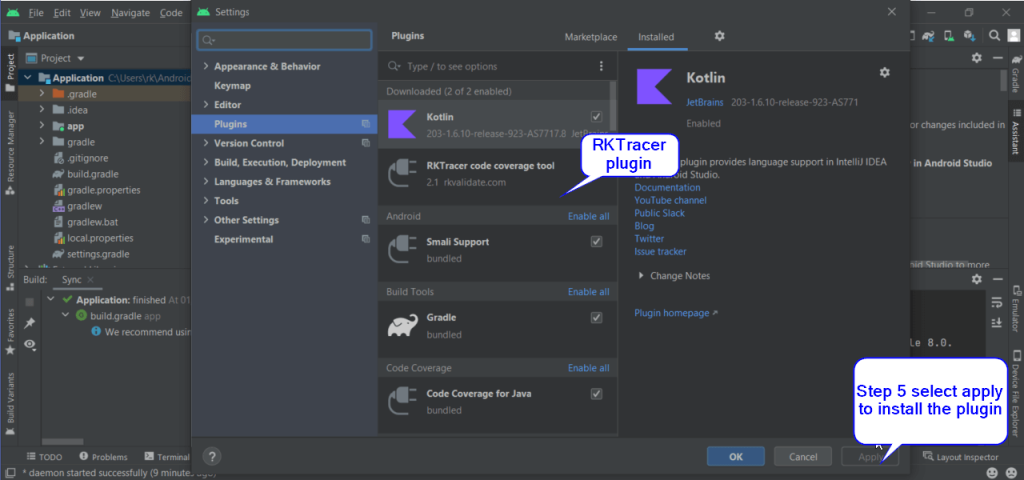
4: Now, we need to restart the android studio IDE. You should see RKTracer options under the Tools menu → The RKTrace option to turn ON or OFF or generate reports.
Generate Code Coverage for Android App in Android Studio IDE.
Following Instructions will work for all the Apps with C/C++ or Java, or Kotlin, or in combination in Android Studio IDE. Ensure that you can build and test the app in android studio or on the phone device.
1.Enable Code Coverage Tool
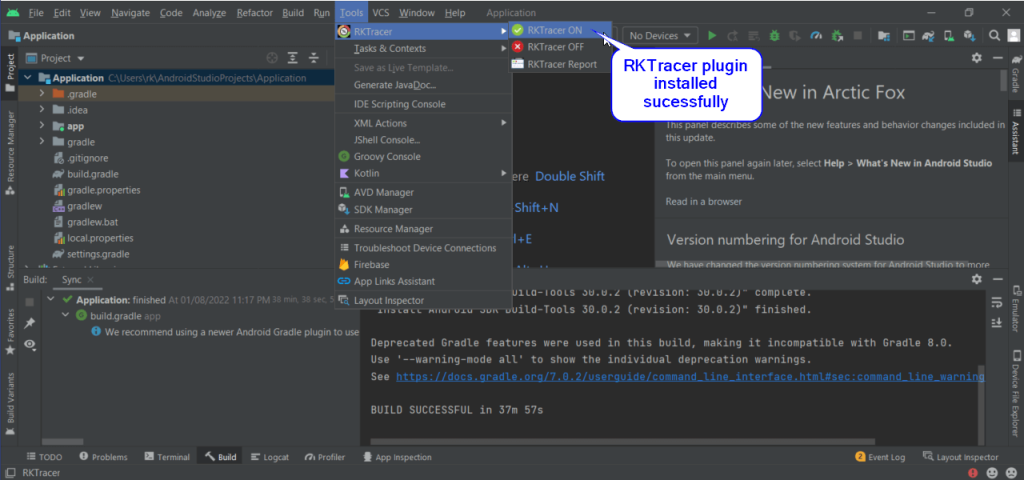
Go to → Tools → RKTracer ON. When you enable the RKTracer Tool for the first time, you might get a popup to grant read/write permission and you need to accept it.
Command-line mode: You can enable the RKTracer tool in command line mode for the
gradle build system with the following steps.
gradlew build
To
rktracer gradle -on app/build.gradle
gradlew clean
gradlew build
2. Rebuild application and run tests
You need to rebuild the app in android studio ide to the instrument with the RKTracer tool as instrumentation takes place at a source code level.
3: Install the APK in the device and test.
By default, the RKTracer tool will autosave coverage data from the emulator or device to the
app working folder in the build machine, provided the device or emulator is connected to the
build machine. If the device/phone has not connected to the build machine at the time of
testing, RKTracer coverage data will be saved in the logcat buffer and the testing device.
You can later save coverage data from logcat log or pull coverage data from device to app
folder in the build machine.
Suppose the device/phone has not connected to the build machine at the time of testing. You
can follow any one of the approaches to save coverage data from your phone.
Just before start testing the app on the device, run the following command.
adb logcat -c // clears the logcat buffer
adb logcat > rk-coverage.txt 2<&1 // Save coverage data from logcatTo pull the coverage data, you can execute the command.
adb pull /data/data/com.example.widecolor/rk-coverage.txt
4: Generate Code Coverage Reports
We can either use the Tools menu → rktracer → report option to generate a report or open a
terminal or command prompt in the project directory. We have the rktracer folder and
execute the following command to generate reports.
If you have captured the coverage data i.e., rk-coverage.txt from logcat or pulled from the
device. You need to copy the rk-coverage.txt to the build machine’s project folder and run the
following command.
Linux: rkresults
Windows: rkresults
If the RKTracer Html reports are not opening in the browser, we can navigate the project
folder/rktracer/reports/ and open index.html to check the reports.
NOTE: Once the reports are generated, you need to Turn OFF the RKTracer tool in android
studio IDE or using command line mode “rktracer gradle -off app/build.gradle” from the
project directory.
Enable coverage for selected files
Generate coverage reports for the selected folders
C:projectsounddriversbasepower
C:projectsounddriversbasepowerfirmware_loader
C:projectsounddriverscore
C:projectsoundsecuritykeys
C:projectsoundsecuritylockdown
Suppose you need code coverage for source files from three different folders, i.e., core, keys, power, and ignore coverage for folders firmware_loader and lockdown. Edit rktracer.config in the RKTracer installation folder and go to the end of the file add the following information.
ignore *.c
instrument */power/* */core/* */keys/*
never */firmware_loader/* */lockdown/*
ignore *.c = Ignores all C source files from instrumentation
Instrument = Instrument source files from given folders
never = ignore selected folder
Generate coverage reports only for selected functions from three different files.
fun_X() in source-file-X
fun_Y() in source-file-Y
fun_Z() in source-file-Z
Suppose you need code coverage for selected functions from three different files. Edit rktracer.config in the RKTracer installation folder and go to the end of the file and set the following variables as shown below.
ignore *.c
instrument *source-file-X.c *source-file-Y.c *source-file-Z.c
function-ignore *
function-instrument fun_X() fun_Y() fun_Z()
ignore *.c = Ignore all C programming source files
instrument *file-X.c *file-Y.c *file-Z.c = Instrument only these three source files.
function-ignore * = Then ignore all functions in the above three files.
function-instrument fun_X() fun_Y() fun_Z() = Don’t ignore these three functions from these three files from instrumentation