
Publish code coverage in Jenkins and SonarQube Code Coverage
We’ve covered how to publish coverage reports to Jenkins and SonarQube using RKTracer for programs based on C, C++, C# ,Java, Kotlin, JavaScript, Python, Golang, Kotlin, and Swift programming languages in our previous posts.
In this article, you’ll learn how to publish RKTracer’s HTML coverage reports to Jenkins and SonarQube.
How to publishing Coverage data to Jenkins
1:Install the RKTracer plugin in Jenkins
2:On the Jenkins dashboard, click on “Project Configuration,” scroll down, and click on the “Post-build Actions” from the drop-down options presented to you, click on the “Publish RKTracer Report.”
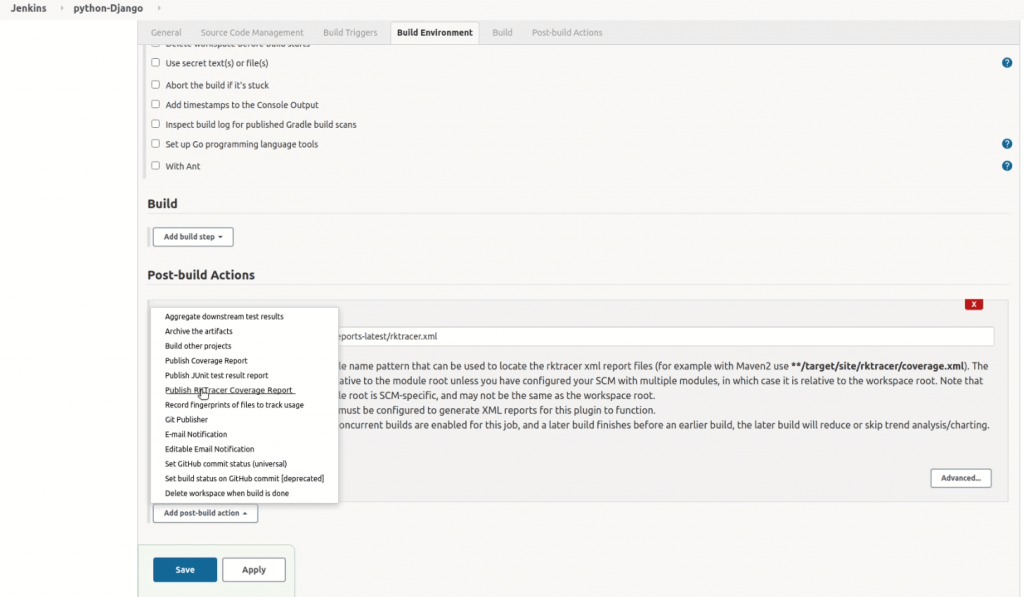
If you have automated the process, the code coverage report will automatically get published on the Jenkins dashboard.
A Brief Overview of the Coverage Report
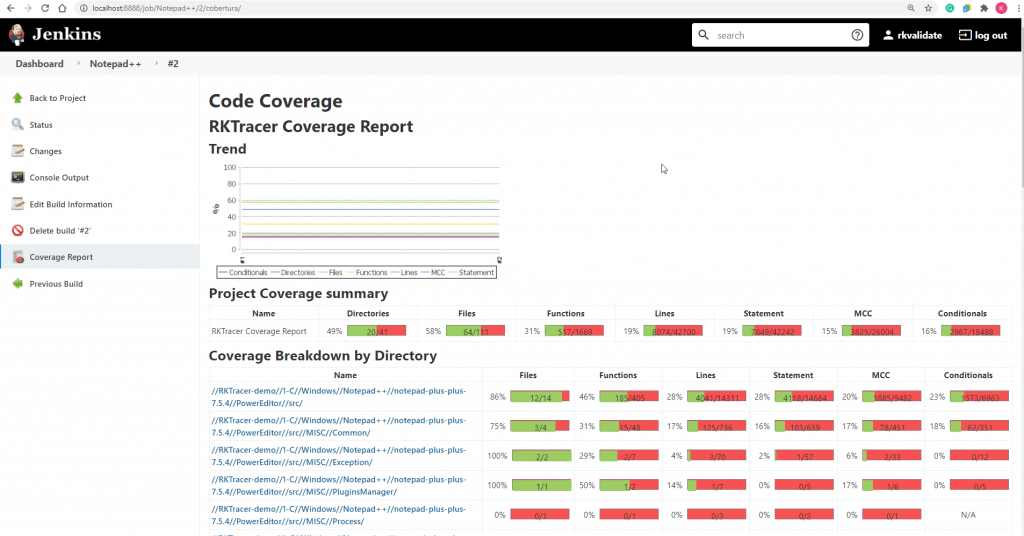
Below is an overview of how published code coverage reports look like
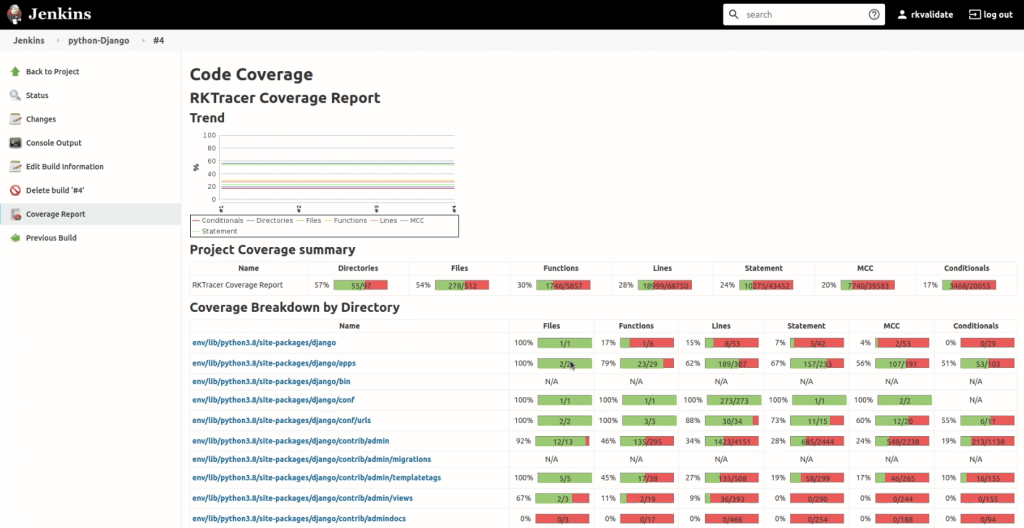
The report includes the number of files available in the folder, functions, code lines, the statement coverage rate, multi-conditional code coverage, and the number of conditions covered.
If you click on any of the files, it will list all the functions, and you have an easy time seeing the code coverage at the function level.
How important is this? Let’s recap:
- Functional coverage results determine how much functionality a design has been exercised during verification. Specifically, a 100% functional coverage indicates that all items in the test pain are tested. This, combined with 100% code coverage, is a clear indication that testing is done.
- Statement Coverage indicates the number of statements executed or the total number of statements in the source code. Using this technique, you can quickly check out what your source code is expected to do and what it’s not expected to do. Statement coverage can also measure the quality of the code and its flow to your program’s different paths.
- Multi conditional code coverage tests if all possible condition outcomes in a decision are tested at least one time. There are only two possible outcomes: true or false. Hence, 2 makes the basis for the number of test situations which can be created. The number of test situations is dependent on the number of conditions, where N is the total amount of conditions.
When you scroll down through the functions, you’ll be able to access the source file.
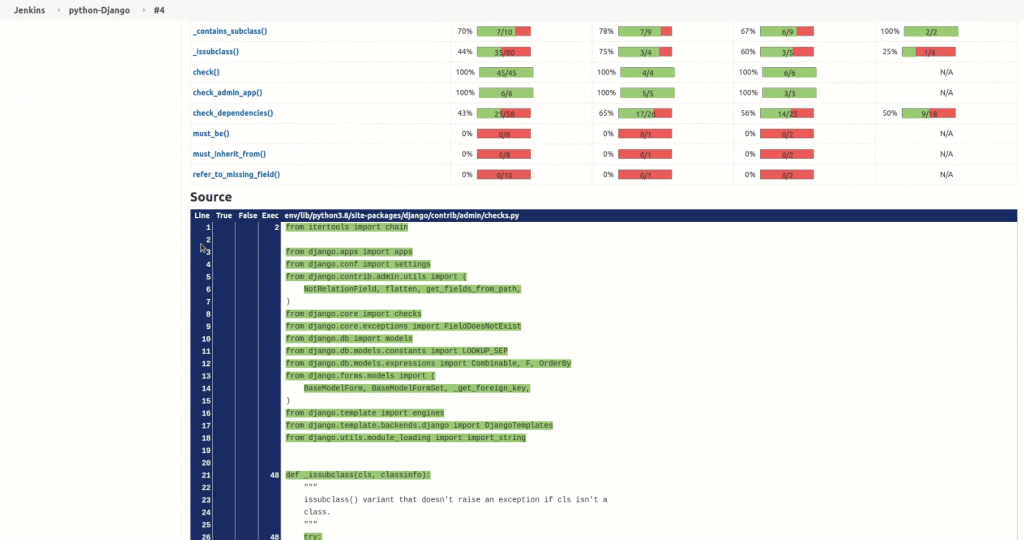
By scrolling down further, you’ll be able to see the color coding for line coverage:
- Green implies covered
- Red implies that the line was not executed.
- Yellow indicates that the condition was executed partially, or some of the conditions were executed.
You can also click on any of the functions above to get the specific function’s code coverage with some more detailed information.
If you want to build a project, run the test cases, and generate the code coverage, You can completely automate the process by integrating the RKTracer tool with the Jenkins build.
How to Publish coverage to SonarQube page
1: On the SonarQube dashboard, click on “Projects” to create a new project.
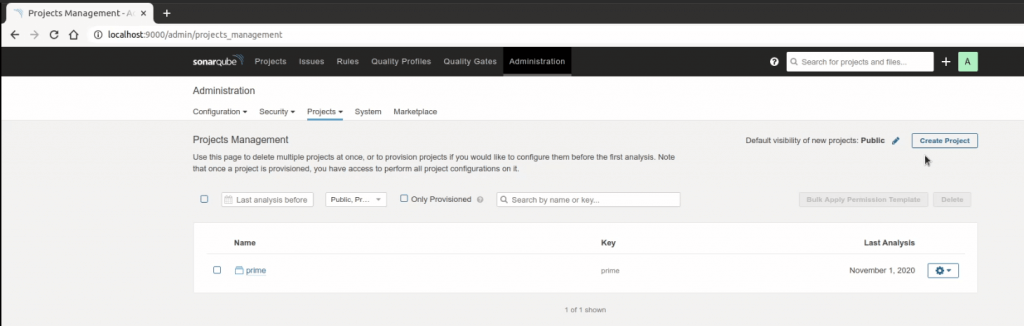
Please give it a name, a key, and once in, go ahead and generate a token.
There are different ways to publish the report. In this case, we’ll go with the simple options provided in the project.
2: Select your programming language and your operating system and copy the black-box analysis.

3: Run sonar scanner from project folder to analyze the code coverage report and to get published to SonarQube.
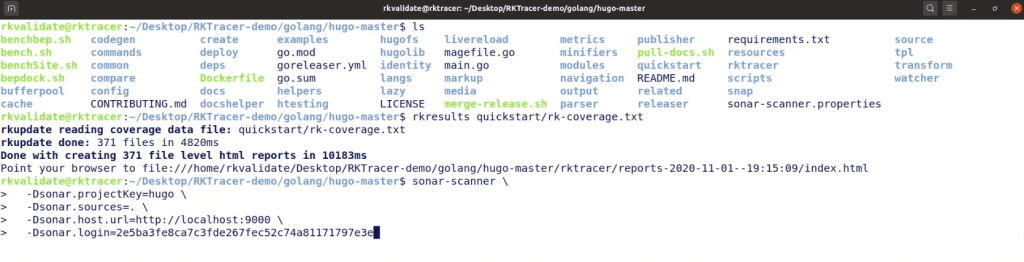
Code Coverage report xml files get analyzed.

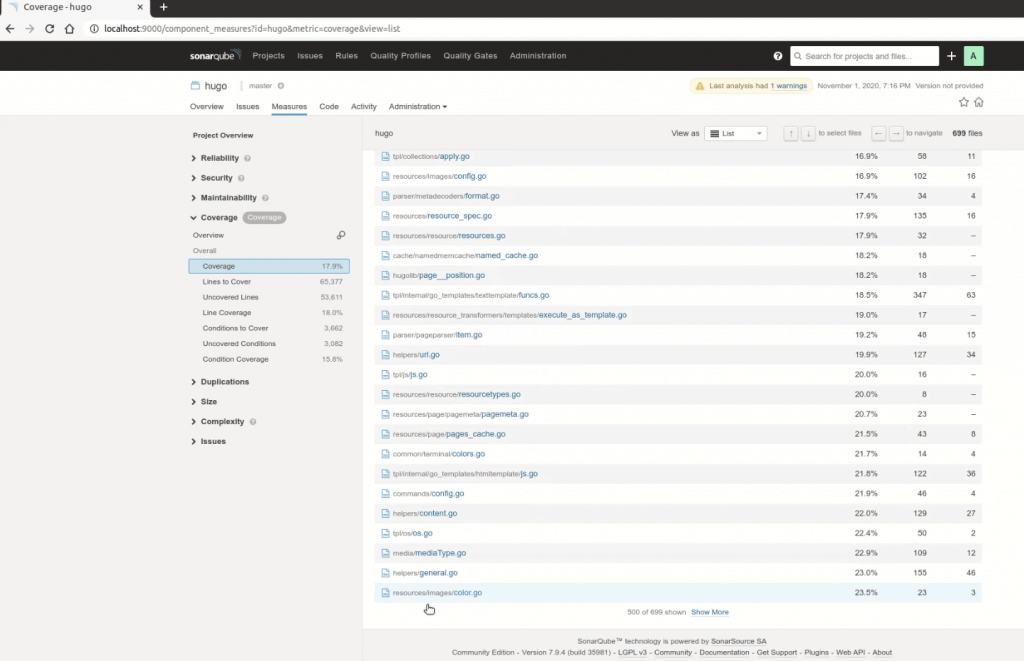
For more file coverage details in SonarQube, you can click on ”Coverage.” You will find details on lines to cover, uncovered lines, line coverage, conditions to cover, uncovered conditions and conditional coverage.
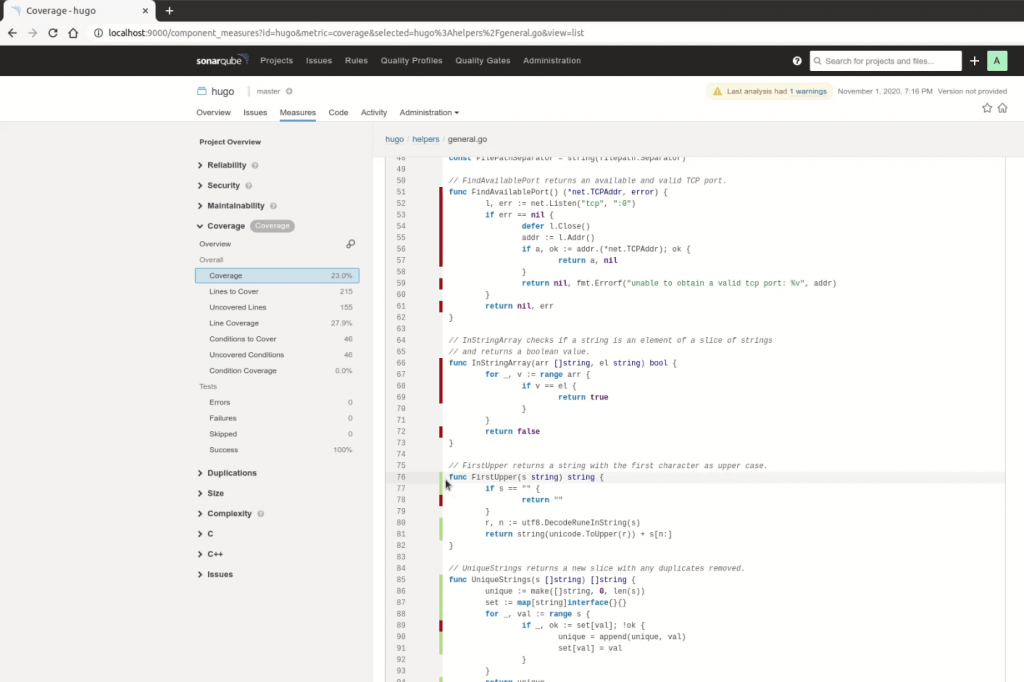
If you click on any of the files and choose to view code coverage, you’ll see the lines that have been covered and those not fully covered. Basically, you should be in a position to get full information regarding code coverage.
Have the Right Tool for Your Project
- Now that you’re here, you’re probably using RKTracer for your code coverage reports. Keep up; that’s one of the best code coverage tools in the market.
Coverage Percentage to Aim For?
- There’s no silver bullet in code coverage. High coverage percentages could still cause problems if crucial parts of your app are not being tested. All the same, it’s good that you aim for 80% coverage. Trying too much to hit higher amounts could end up consuming much of your time without necessarily adding any benefits.
Focus on Unit Testing First
- Unit tests ensure that the methods of the components and classes used by your application are functional. They’re cheap to implement and run, and they as well assure you that the platform’s basis is solid. By starting with unit tests, you’ll be sure that your test suite reaches all lines of your code.
Use Your Coverage Reports to Know Misses in Testing
- You’ll soon have many tests for your code that will make it hard for you to know the part of the application that’s checked during the execution of your tests. Once you’re at this level, coverage reports can give actionable guidelines for your team. RKTracer will help you dig into coverage reports to know actual items that weren’t covered by tests and need to be tested.
We hope that our code coverage publishing guide will be helpful. If you have any questions or need help on code coverage with RKTracer, feel free to contact our support team, and we’ll get back to you immediately.