
Code Coverage for IAR Embedded Workbench IDE
In this 3mins video, you will see how to generate code coverage for embedded applications in IAR embedded workbench IDE using RKTracer Tool with 3 simple steps.
- Enable the RKTracer tool and rebuild the application.
- Test instrumented application and save coverage data.
- Generate code coverage reports

Code Coverage tool integration with IAR Embedded IDE
1: Ensure you have closed the IAR embedded workbench IDE. Open a new command prompt and run the following command to integrate the RKTracer tool with IAR Embedded Workbench IDE.
rktracer -iar -integrate

2: Open IAR embedded workbench IDE, and you should be able to see RKTracer tool options in the Tools menu.
- RKTracer ON: Will enable RKTracer tool for instrumentation
- RKTracer OFF: Will disable RKTracer tool.
- RKTracer Reports: Will generate reports in HTML format.

Generate Code Coverage for Embedded Application in IAR Embedded workbench IDE.
Prerequisites: Once you have successfully integrated the RKTracer tool. At least once you need to build and test the application in embedded target in debug mode and restart the IDE.
Enable Code Coverage Tool
Go to → Tools → RKTracer ON. When you enable the RKTracer Tool for the first time, you might get a popup to grant read/write permission for the IAR Embedded workbench IDE installation folder.
Rebuild application and run tests
If you have connected the embedded target to the host machine at the time of running tests. Then the rktracer tool automatically saves coverage data to the application working directory when you terminate the debug process i.e after running the test cases in the embedded target.
We can also save coverage data automatically when a certain source code line is executed. You need to first connect to the embedded target before running the tests, set the breakpoint, and then right-click edit the breakpoint as shown in the screenshot and add.
rkdump()
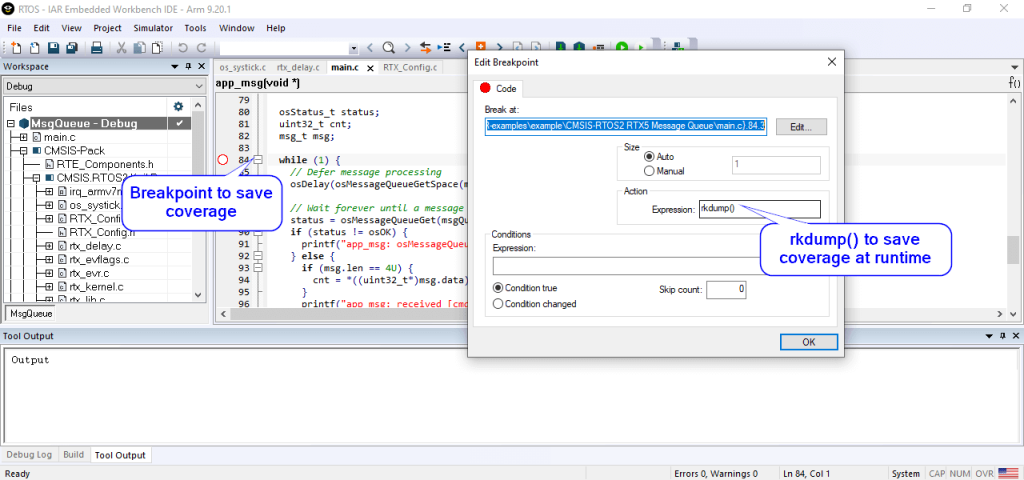
So that when line number 84 (where we have set a breakpoint) executes at runtime, the RKTracer tool will save the coverage data to the “RK-MEM.raw” file in project working directory(while testing on embedded target, make sure you connected to host machine) .
If embedded target is not connected to host ,then contact support. We will provide customized script to transfer coverage data from embedded target to host machine.

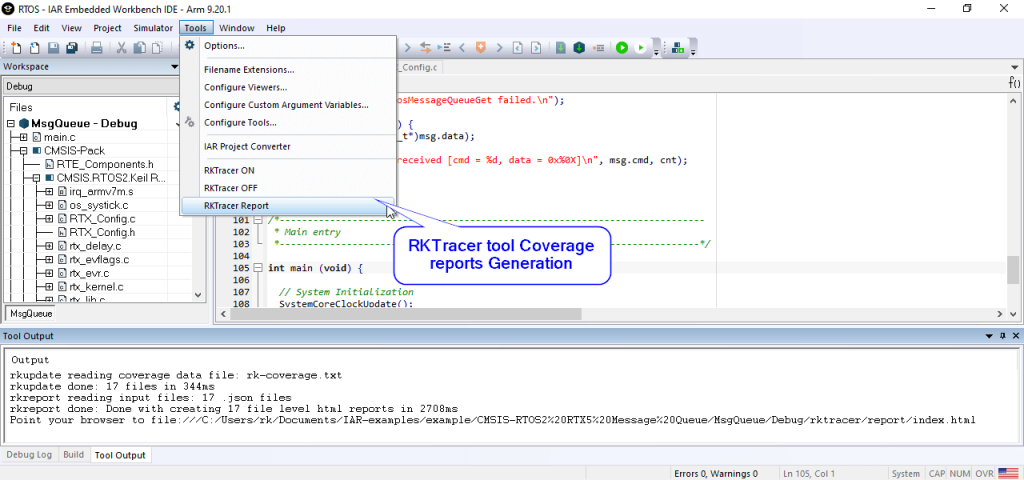
Generate Code Coverage Reports
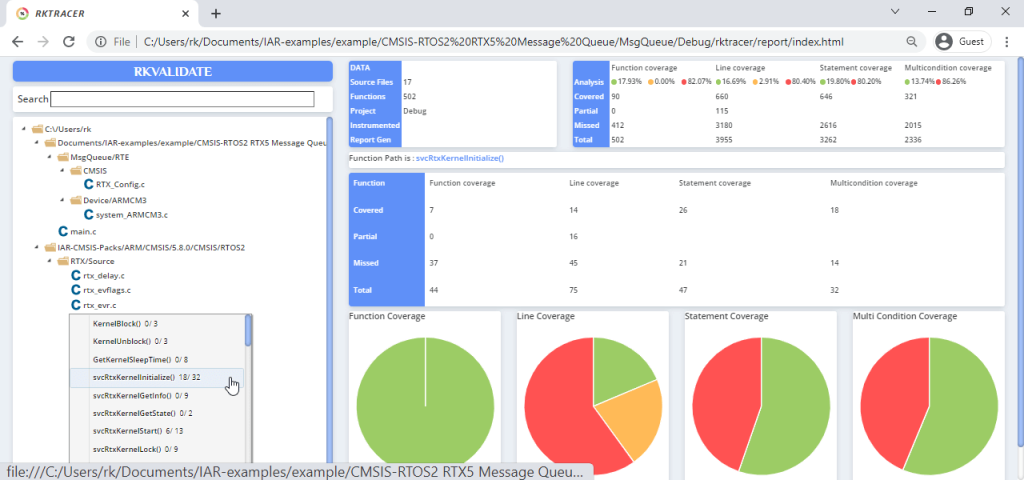
Go to –> Tools menu –> RKTracer Report to generate Html reports. The RKTracer tool will internally convert the “RK_MEM.raw” data file to “rk-coverage.txt” and map with JSON files (generated during instrumentation) in the rktracer folder and generate the HTML reports. You can manually open the HTML report using index.html.
Enable coverage for selected files
Generate coverage reports for the selected folders
C:\project\sound\drivers\base\power\
C:\project\sound\drivers\base\power\firmware_loader\
C:\project\sound\drivers\core\
C:\project\sound\security\keys\
C:\project\sound\security\lockdown\
Suppose you need code coverage for source files from three different folders, i.e., core, keys, power, and ignore coverage for folders firmware_loader and lockdown. Edit rktracer.config in the RKTracer installation folder and go to the end of the file add the following information.
ignore *.c
instrument */power/* */core/* */keys/*
never */firmware_loader/* */lockdown/*
ignore *.c = Ignores all C source files from instrumentation
Instrument = Instrument source files from given folders
never = ignore selected folder
Generate coverage reports only for selected functions from three different files.
fun_X() in source-file-X
fun_Y() in source-file-Y
fun_Z() in source-file-Z
Suppose you need code coverage for selected functions from three different files. Edit rktracer.config in the RKTracer installation folder and go to the end of the file and set the following variables as shown below.
ignore *.c
instrument *source-file-X.c *source-file-Y.c *source-file-Z.c
function-ignore *
function-instrument fun_X() fun_Y() fun_Z()
ignore *.c = Ignore all C programming source files
instrument *file-X.c *file-Y.c *file-Z.c = Instrument only these three source files.
function-ignore * = Then ignore all functions in the above three files.
function-instrument fun_X() fun_Y() fun_Z() = Don’t ignore these three functions from these three files from instrumentation