
Code Coverage for cmake build system
In this video, you will learn how to generate a code coverage cmake application using the RKTracer Tool in 3 simple steps.

You need to prefix “rktracer” command to cmake build command to enable code coverage tool. Runtime libraries will be added to the build system by the RKTracer. Tests can be run on an RKtracer instrumented application on a native host or on an embedded system, and code coverage can be generated.
Code Coverage Cmake build
Here is an example application to demonstrate how code coverage can be generated with Cmake builds.
Enable RKTracer Tool
cmake -G “MinGW Makefiles” “D:\path-to-project\project.”
TO
rktracer -v cmake -G “MinGW Makefiles” “D:\path-to-project\project”
RKTracer tool finds the compiler used in cmake build and then, based on the compiler found makes necessary changes to the CMakeCache.txt file. Now run the “make” command to build and Instrument the project with the RKTracer tool.
Note: Prefixing the “rktracer” command to the “make” command will not work for the cmake build. You need to prefix rktracer to cmake command, not to “make” command.
Now, you can execute the make command
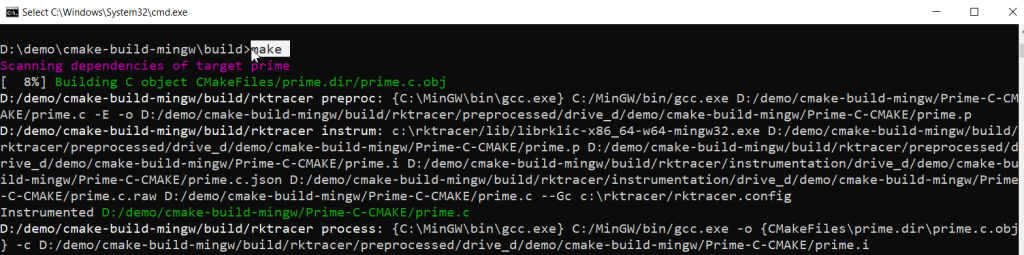
- RKTracer preprocesses the source file with the below command.
- RKTracer instruments the preprocessed file with “c:\rktracer/lib/librklic-x86_64-w64-mingw32.exe ” and writes out the instrumented preprocessed file to “prime.i” file. Also, it stores the metadata, structure of instrumentation, and copy of source file content to corresponding JSON files. Tool will refer rktracer.config for internal configuration at the time of instrumentation.
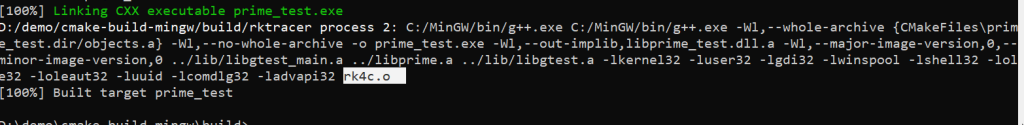
- RKTracer automatically adds runtime at linking time.
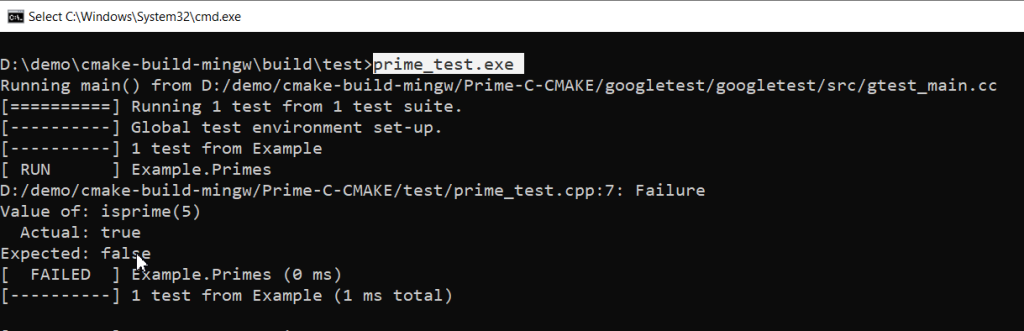
Run tests on instrumented application
You can run unit tests or integration tests in native host machine or embedded systems. In this case, we will run unit tests.
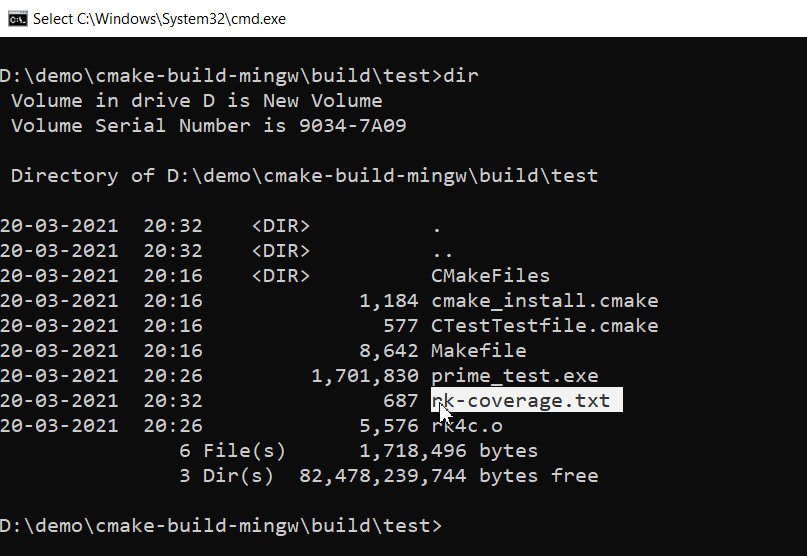
You can also see coverage metrics written out to the rk-coverage.txt file.
Generate Code Coverage HTML reports
Once you have the rk-coverage.txt file, you need to run the command “rkresults” to generate HTML reports. Ensure that you run the “rkresults” command in the project root folder or where we have the “rktracer” folder.

rkresults command will search coverage data file “rk-coverage.txt” and map with JSON files (generated during instrumentation) in the rktracer folder and generate the HTML reports. You can manually open the HTML report using index.html.
Enable coverage for selected files
Generate coverage reports for the selected folders
C:projectsounddriversbasepower
C:projectsounddriversbasepowerfirmware_loader
C:projectsounddriverscore
C:projectsoundsecuritykeys
C:projectsoundsecuritylockdown
Suppose you need code coverage for source files from three different folders, i.e., core, keys, power, and ignore coverage for folders firmware_loader and lockdown. Edit rktracer.config in the RKTracer installation folder and go to the end of the file add the following information.
ignore *.c
instrument */power/* */core/* */keys/*
never */firmware_loader/* */lockdown/*
ignore *.c = Ignores all C source files from instrumentation
Instrument = Instrument source files from given folders
never = ignore selected folder
Generate coverage reports only for selected functions from three different files.
fun_X() in source-file-X
fun_Y() in source-file-Y
fun_Z() in source-file-Z
Suppose you need code coverage for selected functions from three different files. Edit rktracer.config in the RKTracer installation folder and go to the end of the file and set the following variables as shown below.
ignore *.c
instrument *source-file-X.c *source-file-Y.c *source-file-Z.c
function-ignore *
function-instrument fun_X() fun_Y() fun_Z()
ignore *.c = Ignore all C programming source files
instrument *file-X.c *file-Y.c *file-Z.c = Instrument only these three source files.
function-ignore * = Then ignore all functions in the above three files.
function-instrument fun_X() fun_Y() fun_Z() = Don’t ignore these three functions from these three files from instrumentation