Code Coverage for Tizen Studio IDE
You will see how to generate code coverage for embedded applications in Tizen Studio IDE using RKTracer Tool with 3 simple steps.
- Enable the RKTracer tool and rebuild the application.
- Test instrumented application and save coverage data.
- Generate code coverage reports
Code Coverage tool integration with Tizen Studio IDE
1: Open a command prompt(Windows) or terminal(Linux) and execute the following command to integrate the RKTracer tool with Tizen Studio IDE.
rktracer -tizen -integrate
2: On successful integration with Tizen Studio IDE. You should be able to see the RKTracer tool option under Run menu–>External tools>
- RKTracer ON: Will enable RKTracer tool for instrumentation
- RKTracer OFF: Will disable RKTracer tool.
- RKTracer Reports: Will generate reports in HTML format.

Generate Code Coverage for Embedded Application in Tizen Studio IDE.
Prerequisites: Once you have successfully integrated the RKTracer tool. At least once you need to build and test the application in embedded target in debug mode and restart the IDE.
Enable Code Coverage Tool
Select project in IDE with the mouse pointer, as shown in the following screenshot. Tizen Studio doesn’t recognize when we try to turn ON/OFF/Report generate using RKTracer options.
Now go to the run menu→ External Tools and select RKTracer ON to turn on the RKTracer tool. Once the RKTracer tool is turned on, you should see the following information in the console output tab.
rktracer options: -v
to change options edit Project → Properties → Resources → ‘Linked Resources’ → ‘Path Variables’ → RK_ARGS

𝗿𝗸𝘁𝗿𝗮𝗰𝗲𝗿 switched 𝗢𝗡 in C:\tizen-studio\ide/Templates/native/ninja/rules.ninja
Rebuild application and run tests
Before you test the app on the device, open the project working directory in the command prompt and redirect the sdb dlog output to the rk-coverage.txt file. You should not change the rk-coverage.txt file name. As RKTracer tool only recognizes the rk-coverage.txt file as code coverage data.
sdb dlog > rk-coverage.txt

Now install the app on the device or emulator and test it. Once testing is completed, kill the command that we are running in the command prompt.
sdb dlog > rk-coverage.txt
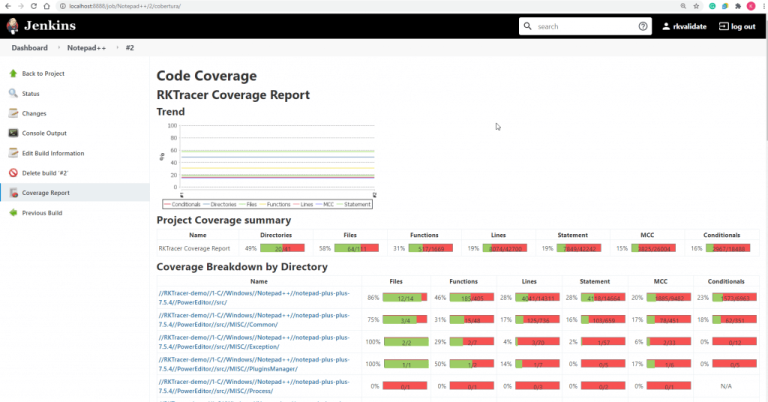
Generate Code Coverage Reports
To generate the reports go to Tizen Studio IDE and select the project using mouse point as we did earlier before instrumentation and then goto → Run menu→ External Tools and select RKTracer report to generate rktracer code coverage Html reports.
Note: if code coverage reports are not opening automatically in the browser. You should find the reports under.
Project-working-directory/rktracer/reports/index.html
Enable coverage for selected files
Generate coverage reports for the selected folders
C:projectsounddriversbasepower
C:projectsounddriversbasepowerfirmware_loader
C:projectsounddriverscore
C:projectsoundsecuritykeys
C:projectsoundsecuritylockdown
Suppose you need code coverage for source files from three different folders, i.e., core, keys, power, and ignore coverage for folders firmware_loader and lockdown. Edit rktracer.config in the RKTracer installation folder and go to the end of the file add the following information.
ignore *.c
instrument */power/* */core/* */keys/*
never */firmware_loader/* */lockdown/*
ignore *.c = Ignores all C source files from instrumentation
Instrument = Instrument source files from given folders
never = ignore selected folder
Generate coverage reports only for selected functions from three different files.
fun_X() in source-file-X
fun_Y() in source-file-Y
fun_Z() in source-file-Z
Suppose you need code coverage for selected functions from three different files. Edit rktracer.config in the RKTracer installation folder and go to the end of the file and set the following variables as shown below.
ignore *.c
instrument *source-file-X.c *source-file-Y.c *source-file-Z.c
function-ignore *
function-instrument fun_X() fun_Y() fun_Z()
ignore *.c = Ignore all C programming source files
instrument *file-X.c *file-Y.c *file-Z.c = Instrument only these three source files.
function-ignore * = Then ignore all functions in the above three files.
function-instrument fun_X() fun_Y() fun_Z() = Don’t ignore these three functions from these three files from instrumentation