
Code Coverage for Visual Studio MSBuild system
You will learn how to generate a code coverage for MSBuild system applications using the RKTracer Tool in 3 simple steps.
You need to prefix “rktracer” command to MSBuild command to enable code coverage tool. Runtime libraries will be added to the build system by the RKTracer. Tests can be run on an RKtracer instrumented application on a native host or on an embedded system, and code coverage can be generated.
| SL/No | Makefile command | with RKTracer tool | Description |
| 1 | msbuild | rktracer msbuildrktracer msbuild | instruments all the source file in silent mode for multi conditions |
| 2 | rktracer -v msbuild | instrument all source files and displays verbose log for multi conditions | |
| 3 | rktracer -v -branch msbuild | instrument all source files and displays verbose log for branch/decision coverage | |
| 4 | rktracer -v -r msbuild | instrument all source files and displays verbose log for multi conditions in raw mode. RAW mode coverage will be stored in the RK_MEM variable. |
RKTracer tool internally checks the compiler used by the makefile variable and instrument all the source files compiled. By default, rktracer instruments for multi-condition, and you see the following code coverage information in the HTML report.
- Function Coverage
- Line Coverage
- Statement Coverage
- Multi-Condition Code Coverage
Code Coverage for MSBuild System
Here is an example application to demonstrate how code coverage can be generated with MSBuild system.
Enable RKTracer Tool
msbuild project-name.sln /t:rebuild
TO
rktracer -v msbuild project-name.sln /t:rebuild

RKTracer preprocesses the source file with the below command
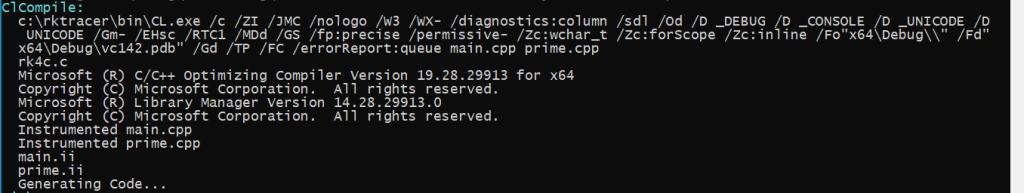
RKTracer instruments the preprocessed file with “c:\rktracer/lib/librklic-x86_64-w64-mingw32.exe ” and writes out the instrumented preprocessed file to “prime.ii” file. Also, it stores the metadata, structure of instrumentation, and copy of source file content in JSON file. The tool will refer rktracer.config for internal configuration at the time of instrumentation.
RKTracer automatically adds runtime at linking time.

Run tests on instrumented application
You can run unit tests or integration tests in native host machine or embedded systems. In this case, we will do functional tests.
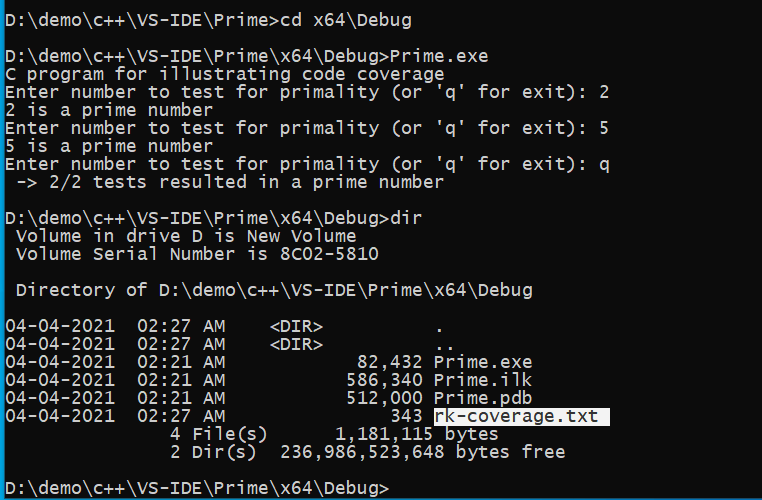
You can also see coverage metrics written out to the rk-coverage.txt file.
Generate Code Coverage HTML reports
Once you have the rk-coverage.txt file, you need to run the command “rkresults” to generate HTML reports. Ensure that you run the “rkresults” command in the project root folder or where we have the “rktracer” folder.
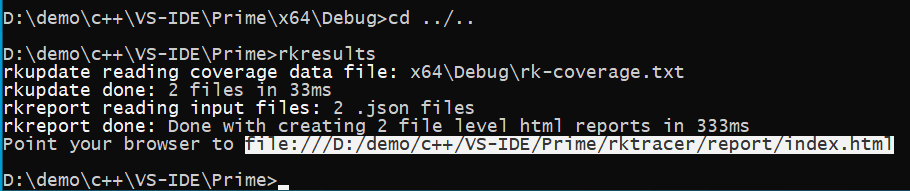
rkresults command will search coverage data file “rk-coverage.txt” and map with JSON files (generated during instrumentation) in the rktracer folder and generate the HTML reports. You can manually open the HTML report using index.html.
Enable coverage for selected files
Generate coverage reports for the selected folders
C:projectsounddriversbasepower
C:projectsounddriversbasepowerfirmware_loader
C:projectsounddriverscore
C:projectsoundsecuritykeys
C:projectsoundsecuritylockdown
Suppose you need code coverage for source files from three different folders, i.e., core, keys, power, and ignore coverage for folders firmware_loader and lockdown. Edit rktracer.config in the RKTracer installation folder and go to the end of the file add the following information.
ignore *.c
instrument */power/* */core/* */keys/*
never */firmware_loader/* */lockdown/*
ignore *.c = Ignores all C source files from instrumentation
Instrument = Instrument source files from given folders
never = ignore selected folder
Generate coverage reports only for selected functions from three different files.
fun_X() in source-file-X
fun_Y() in source-file-Y
fun_Z() in source-file-Z
Suppose you need code coverage for selected functions from three different files. Edit rktracer.config in the RKTracer installation folder and go to the end of the file and set the following variables as shown below.
ignore *.c
instrument *source-file-X.c *source-file-Y.c *source-file-Z.c
function-ignore *
function-instrument fun_X() fun_Y() fun_Z()
ignore *.c = Ignore all C programming source files
instrument *file-X.c *file-Y.c *file-Z.c = Instrument only these three source files.
function-ignore * = Then ignore all functions in the above three files.
function-instrument fun_X() fun_Y() fun_Z() = Don’t ignore these three functions from these three files from instrumentation