Code Coverage for Python Applications
In this 8mins video, you will see how to generate code coverage for python based application in command line interface using RKTracer Tool with 3 simple steps.
- Enable the RKTracer tool and rebuild the application.
- Test instrumented application and save coverage data.
- Generate code coverage reports
To generate code coverage for python-based applications using the RKTracer tool. You need to add the RKTracer runtime library to the python installation folder be windows or Linux platform and instrument the application with the RKTracer tool. Then test the instrumented application and generate code coverage.
Adding RKTracer tool runtime library to Python Installation
Adding RKTracer runtime library rk4python.py to the python installation folder is a one-time setup.
Windows :To Integrate RKTracer runtime library source file to Python Lib folder. You can follow the following instructions.
Open a command prompt and run the command.
where python

If python is in the path, then you should see the following output.
C:\Python39
Step 2: The command output gives us the path where python is installed, and you need to copy rk4python.py from the RKTracer installation folder to the python library folder.
C:\rktracer\share\rktracer to C:\Python39\Lib
Now your all set to instrument your application with the RKTracer tool and generate code coverage.
Linux : To Integrate RKTracer runtime library source file with Python Lib folder. You can follow the following instructions.
Open a Linux terminal and run the following command.
python3 -v 2>&1| grep os.py
If python is in the path, you should see the following output after executing the above command if nothing displays or see a blank terminal. Press Enter key on the keyboard, and the command should display the path has shown in the following screenshot. To come out of this command, use the keyboard key “control+d.”

Now copy the RKTracer runtime library to the path, the i.e./usr/lib/python3.8/ shown in the terminal with the following command.
sudo cp ~/rktracer/share/rktracer/rk4python.py /usr/lib/python3.8/
Now your all set to instrument your application with the RKTracer tool and generate code coverage.
Code Coverage for Python applications example
Identify the application folder for which you need code coverage data and instrument using the rktracer tool using the following steps. Make sure your application is configured and you’re able to test it.
Enable the RKTracer tool
Execute the following command to Turn ON (instrument) or Turn OFF (un-instrument) rktracer tool. The RKTracer tool command will instrument all source files with py extension.
RKTracer Turn ON/OFF commands
rktracer -on path-toproject/module/ py -v
rktracer -off path-toproject/module/ py -v
“py” at the end means rktracer needs to only instrument python source files.
“-v” at the end means rktracer needs show verbose instrumentation log.
The above command will instrument all the python source files in the project folder recursively to exclude source files or folders from instrumentation.
Run Tests on instrumented application
Testing can be unit-testing or functional/integration testing of the application.
Once the testing is completed, you should see the rk-coverage.txt file in a testing environment, copy the rk-coverage.txt file to the application working folder or the application path where you have executed the command “rktracer -on path-toproject/module/ py -v” to instrument the project folder using the RKTracer tool. You should also see the “rktracer” folder in the project work directory. The “rktracer” folder will get generated at the time of the instrumentation.
You need to copy the rk-coverage.txt file parallel to the rktracer folder in the project directory.
Generate Code Coverage reports
Once you have the rk-coverage.txt file you need to run the “rkresults” command to generate code coverage HTML reports. Ensure that you run the “rkresults” command in the application root folder or where you have the “rktracer” folder generated at the time of build/Instrumentation.
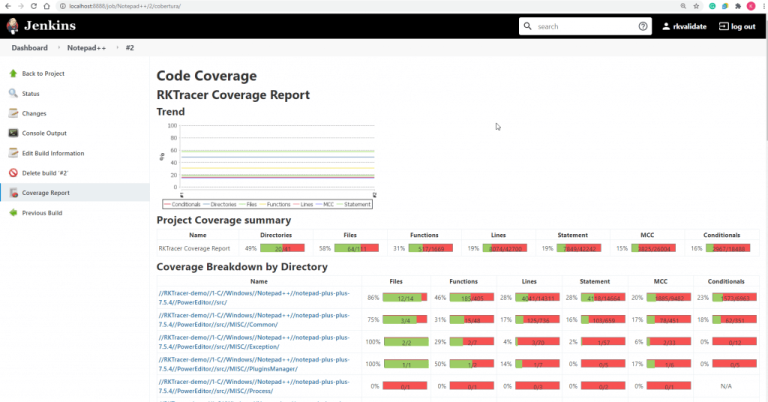
rkresults command will search coverage data file “rk-coverage.txt” and map with JSON files (generated during instrumentation) in the rktracer folder and generate the HTML reports. You can manually open the HTML report using index.html.
After generating code coverage, make sure to turn off(un-instrument) the RKTracer tool for the application that we instrument.
rktracer -off path-toproject/module/ py -v
Enable coverage for selected files
Generate coverage reports for the selected folders
C:\project\sound\drivers\base\power\
C:\project\sound\drivers\base\power\firmware_loader\
C:\project\sound\drivers\core\
C:\project\sound\security\keys\
C:\project\sound\security\lockdown\
Suppose you need code coverage for source files from three different folders, i.e., core, keys, power, and ignore coverage for folders firmware_loader and lockdown. Edit rktracer.config in the RKTracer installation folder and go to the end of the file add the following information.
ignore *.py
instrument */power/* */core/* */keys/*
never */firmware_loader/* */lockdown/*
ignore *.py = Ignores all python source files from instrumentation
Instrument = Instrument source files from given folders
never = ignore selected folder
Generate coverage reports only for selected functions from three different files.
fun_X() in source-file-X
fun_Y() in source-file-Y
fun_Z() in source-file-Z
Suppose you need code coverage for selected functions from three different files. Edit rktracer.config in the RKTracer installation folder and go to the end of the file and set the following variables as shown below.
ignore *.py
instrument *source-file-X.py *source-file-Y.py *source-file-Z.py
function-ignore *
function-instrument fun_X() fun_Y() fun_Z()
ignore *.py = Ignore all python programming source files
instrument *file-X.py *file-Y.py *file-Z.py = Instrument only these three source files.
function-ignore * = Then ignore all functions in the above three files.
function-instrument fun_X() fun_Y() fun_Z() = Don’t ignore these three functions from these three files from instrumentation.


