Code Coverage for CUDA NVIDIA GPU Host and Device.
Code coverage for CUDA NVIDIA ( GPU code) is crucial for several reasons, especially given the increasing complexity and criticality of GPU-accelerated applications in this age.
Here’s why it’s important and how it helps in the context of software development related to GPU code
GPU Code Complexity: GPU programming involves managing a large number of threads executing in parallel. This complexity makes it harder to predict all possible states and behaviours of the software.
Parallel Execution: GPU code often executes in a massively parallel environment, where slight variations in thread execution can lead to different outcomes. Code coverage helps ensure that all potential execution paths, including those involving thread divergence, race conditions, and synchronization issues, are tested.
Identifying Performance Bottlenecks: By analysing code coverage, developers can identify which parts of the GPU code are being executed frequently and which are not. This information is critical for optimizing performance, as it allows developers to focus their efforts on the most critical sections of the code.
Avoiding Blind Spots: and Bug Detection: Code coverage helps in identifying untested code paths, which might harbour undetected bugs. For GPU code, this is particularly important because bugs can lead to unpredictable behaviour across thousands of parallel threads. Uncovered Code Paths: If only host code coverage is analysed, there could be significant portions of the GPU code that remain untested, leading to potential blind spots.
Regression Testing: As GPU codebases evolve, maintaining high code coverage helps ensure that new changes do not introduce regressions, particularly in parts of the code that are not frequently touched but are critical to overall functionality.
Comprehensive Testing: End-to-End Validation: Only testing host code coverage might leave parts of the GPU code untested, especially if certain GPU kernels are not invoked or if they are invoked under specific conditions that were not covered. Conversely, only testing GPU code without ensuring that all relevant host code paths are covered could miss out on scenarios where GPU kernels are not launched or are launched incorrectly.
How to Generate CUDA Code Coverage Both HOST and Device (GPU) Code on Linux ?
This guide will walk you through the process of generating code coverage for both the host and device code of your base application using the Makefile build system in Linux. You will learn how to enable RKTracer and generate a code coverage report in just three simple steps.
Step 1: Build Your Application with RKTracer
In this step, we will prefix the rktracer keyword to the Makefile build command. Doing this ensures that RKTracer instruments the code during the build process.
Instructions:
- Open your terminal and navigate to your project’s root directory.
- Instead of running your regular build command, use the following command:
rktracer make
This command will do the following:
- Preprocess all the source files by the nvcc compiler.
- Instrument the pre-processed files with coverage collection mechanisms.

This step ensures that RKTracer is tracking the execution of both the host and GPU (device) code when the application runs.
Step 2: Run Your Tests
Now that your application has been instrumented and built with RKTracer, it’s time to run the tests. These can include any type of tests, such as:
- Unit tests
- Integration tests
- System tests
- Functional tests
Running these tests will execute your code and collect coverage data at runtime for both the host and GPU code.
Example:
You can run your tests as you normally would. For example:
./run_tests

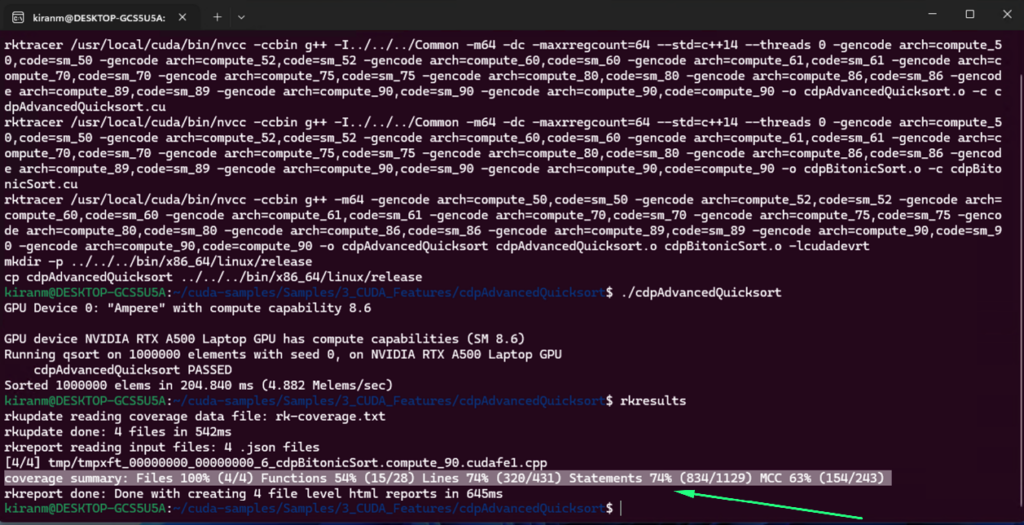
Step 3: Generate the Code Coverage Report
Once your tests have completed running, you can generate the coverage report. This report will provide detailed coverage data for both the host (CPU) code and the device (GPU) code.
Instructions:
In the terminal, run the following command to generate the report:
rkresults
This command will:
- Gather the coverage data collected during the test runs.
- Analyze the data for both host and GPU code.
- Generate an HTML code coverage report that can be viewed in a browser.

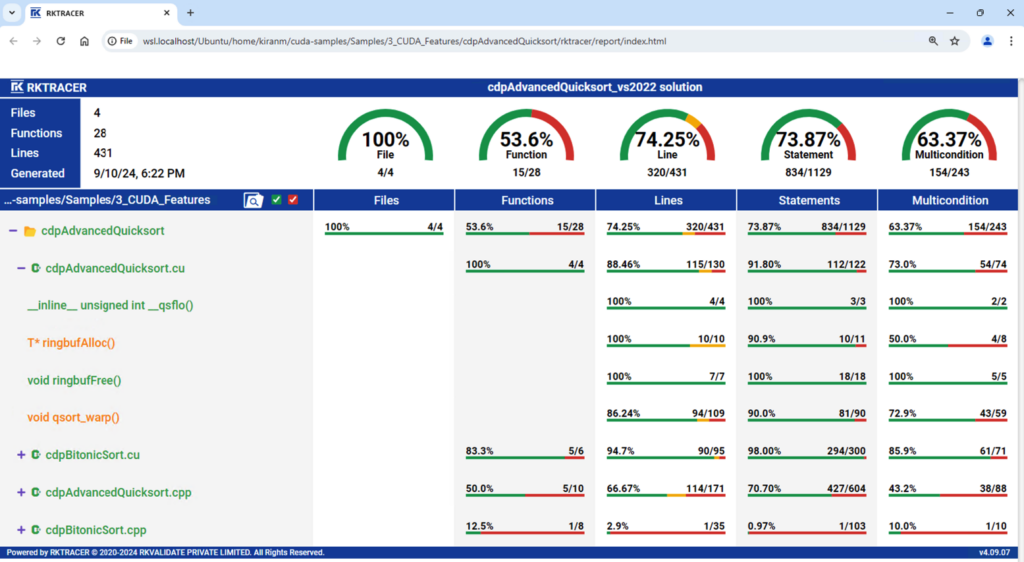
Viewing the Code Coverage Report
- The report is generated in an HTML format and can be viewed in any web browser.
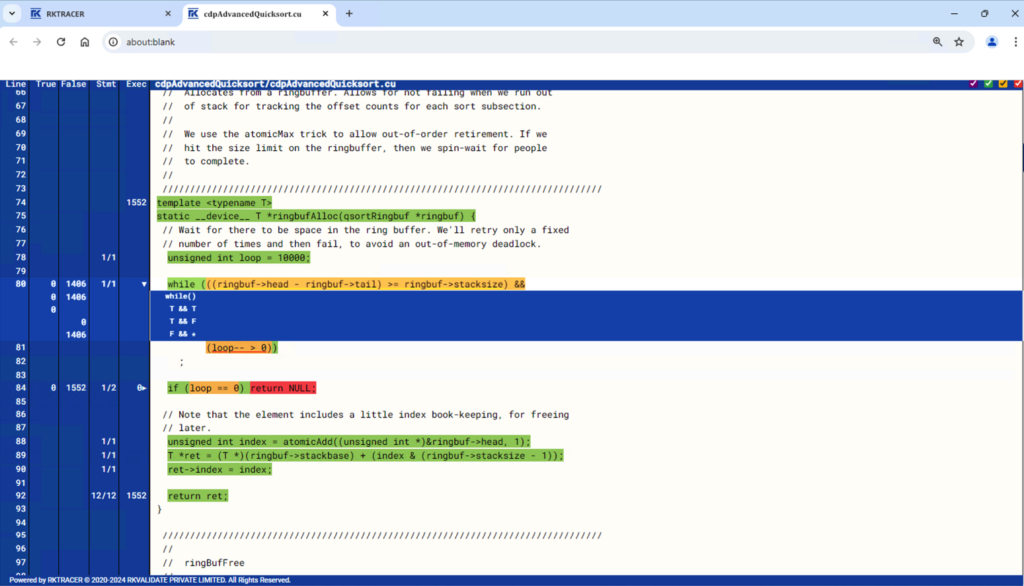
- In the report:
- Green sections indicate that the code was fully covered (executed).
- Yellow sections indicate partial coverage.
- Red sections indicate that the code was not executed during the tests.
Example:
From the screenshot of the report, you will see the code coverage for both the host and GPU code. The report includes a detailed view down to the source code level, allowing you to see exactly which parts of your code were covered during execution.
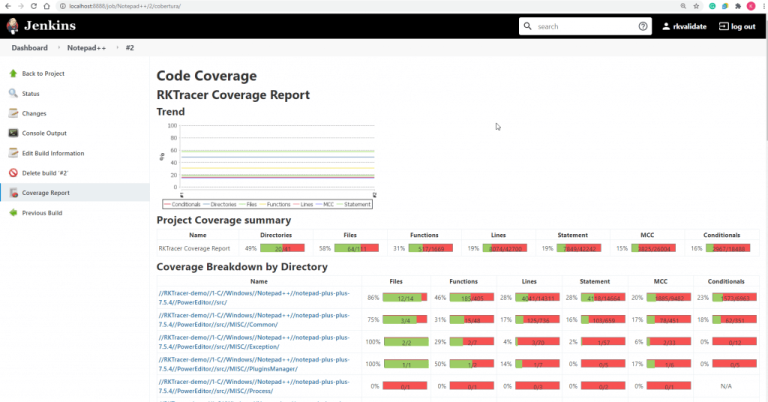
Generate CUDA Code Coverage Both HOST and Device (GPU) Code in Windows Visual Studio IDE ?
In this guide, you will learn how to enable RKTracer to generate code coverage for both your host (CPU) and GPU (device) code using Visual Studio IDE in Windows. We will follow easy steps to ensure proper integration with Visual Studio and generation of the code coverage report.
Ensure the Project is Buildable and Testable
Before integrating RKTracer, make sure that your project:
- Builds successfully in Visual Studio IDE.
- Can run unit tests, integration tests, system tests, or functional tests.
Ensure everything is working fine in your development environment before moving to the next step.
Step 1: Integrate RKTracer with Visual Studio
After verifying your project, you need to integrate RKTracer with Visual Studio IDE. This is done via a simple command.
Instructions:
- Close Visual Studio IDE.
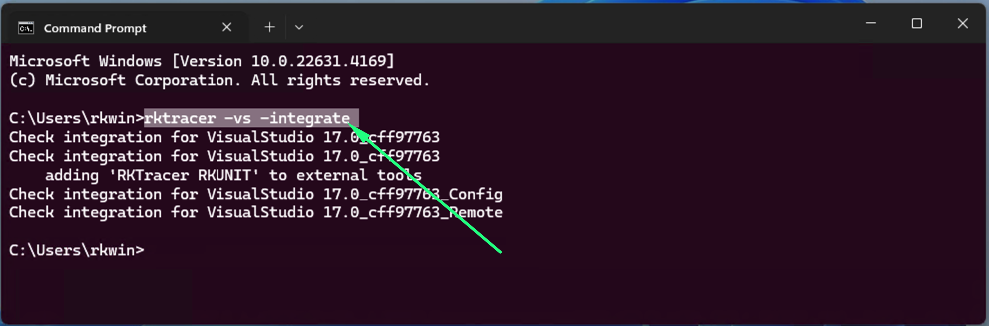
- Open the command prompt and run the following command:
rktracer -vs -integrate
This command automatically integrates RKTracer with Visual Studio IDE.
- After successful integration, reopen Visual Studio IDE.
Step 2: Enable RKTracer in Visual Studio
Once RKTracer is integrated, we can enable the code coverage tool within Visual Studio IDE.
Instructions:
- Open your project in Visual Studio IDE.
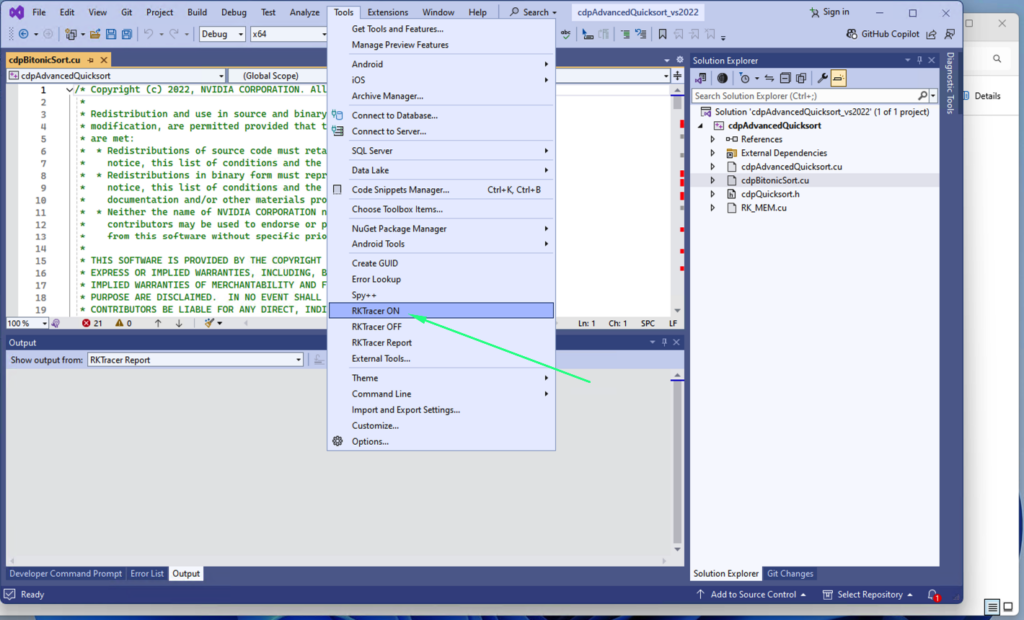
- In the top menu, click on Tools.
- In the Tools menu, you will see three RKTracer options
- RKTracer On: Turns on RKTracer code coverage.
- RKTracer Off: Turns off RKTracer.
- RKTracer Report: Generates the coverage report.
4. Click RKTracer On to enable RKTracer for your project.
Step 3: Clean and Rebuild the Project
Once RKTracer is turned on, it will instrument your source code to collect coverage data. The next step is to clean and rebuild your project.
Instructions:
- In the Visual Studio toolbar, click Build and select Clean Solution.
- Once the project is cleaned, click Build and select Rebuild Solution.
This step ensures that RKTracer can track and instrument both host (CPU) code and GPU (CUDA) code.
Step 4: Run Tests and Collect Coverage Data
After rebuilding the project, run your tests as usual. RKTracer will automatically collect code coverage data at runtime for both host (CPU) and GPU (CUDA) code.
Example: You can run your tests directly from Visual Studio:
Step 5: Generate the Code Coverage Report
Once the tests have been completed, it’s time to generate the code coverage report.
Instructions:
- Go back to Tools in Visual Studio.
- Click RKTracer Report from the RKTracer options.
This command will analyze the collected data and generate a code coverage report. The report will show detailed coverage for both your host and GPU code.

Viewing the Code Coverage Report
The report will be generated as an HTML file that you can open in any browser. In the report:
- Green sections indicate that the code was fully covered (executed).
- Red sections indicate that the code was not executed.
- Yellow sections indicate partial coverage.
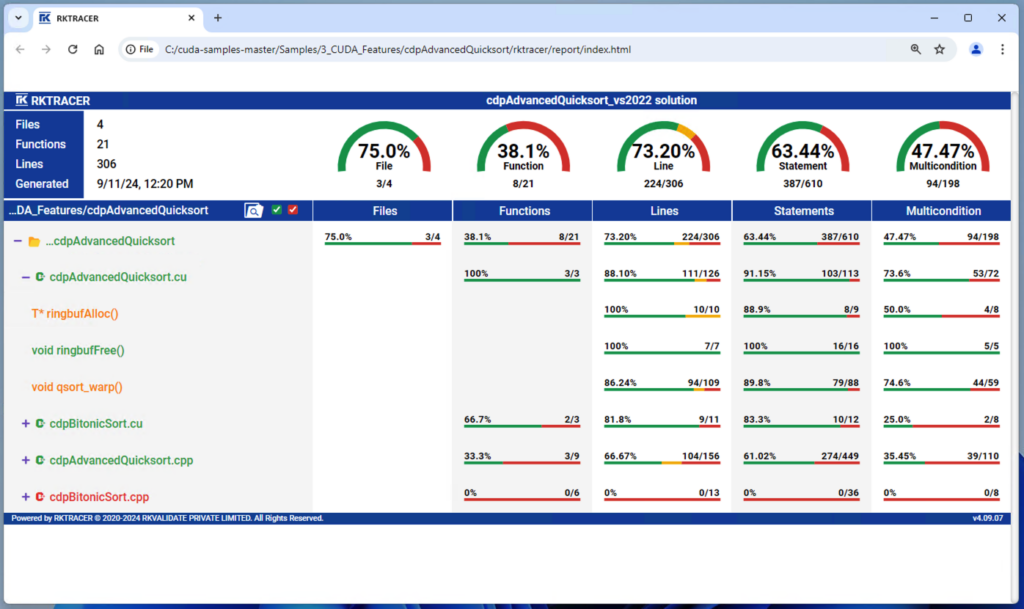

Example:
From the report’s landing page, you will be able to view both the host code (CPP files) and the GPU code (CU files). The color coding will help you easily identify which parts of the code were covered during the tests.
Enable coverage for selected files
Generate coverage reports for the selected folders
C:projectsounddriversbasepower
C:projectsounddriversbasepowerfirmware_loader
C:projectsounddriverscore
C:projectsoundsecuritykeys
C:projectsoundsecuritylockdown
Suppose you need code coverage for source files from three different folders, i.e., core, keys, power, and ignore coverage for folders firmware_loader and lockdown. Edit rktracer.config in the RKTracer installation folder and go to the end of the file add the following information.
ignore *.c
instrument */power/* */core/* */keys/*
never */firmware_loader/* */lockdown/*
ignore *.c = Ignores all C source files from instrumentation
Instrument = Instrument source files from given folders
never = ignore selected folder
Generate coverage reports only for selected functions from three different files.
fun_X() in source-file-X
fun_Y() in source-file-Y
fun_Z() in source-file-Z
Suppose you need code coverage for selected functions from three different files. Edit rktracer.config in the RKTracer installation folder and go to the end of the file and set the following variables as shown below.
ignore *.c
instrument *source-file-X.c *source-file-Y.c *source-file-Z.c
function-ignore *
function-instrument fun_X() fun_Y() fun_Z()
ignore *.c = Ignore all C programming source files
instrument *file-X.c *file-Y.c *file-Z.c = Instrument only these three source files.
function-ignore * = Then ignore all functions in the above three files.
function-instrument fun_X() fun_Y() fun_Z() = Don’t ignore these three functions from these three files from instrumentation