
Code Coverage for code composer studio (CCStudio) IDE
In this 3mins video, you will see how to generate code coverage for embedded applications in Code Composer Studio IDE using RKTracer Tool with 3 simple steps.
- Enable the RKTracer tool and rebuild the application.
- Test instrumented application and save coverage data.
- Generate code coverage reports

Code Coverage tool integration with Code Composer Studio IDE
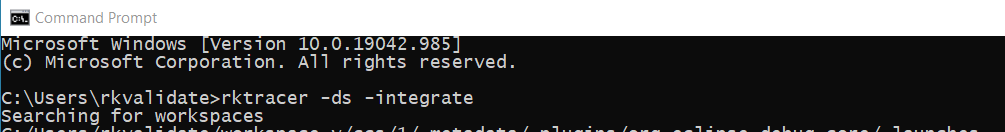
1: Ensure you have closed the Code Composer Studio IDE, open a new command prompt, and run the following command to integrate the RKTracer tool with code composer studio IDE.
rktracer -ds -integrate
2: Open Code Composer Studio IDE . The RKTracer tool options will be in External tools and by default, in code composer studio ide External tools options are disabled. You need to enable using the following steps.
go to → Windows→ perspective→ customized perspective
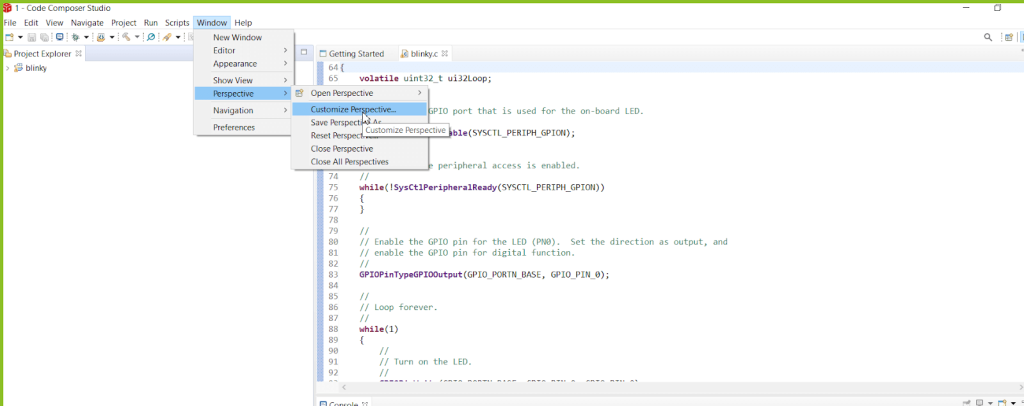
Select Toolbar Visibility→ Launch and select External tools

Then select the next Menu Visibility tab. Go to → Run and scroll down to end, and you should select External tools, apply and close.


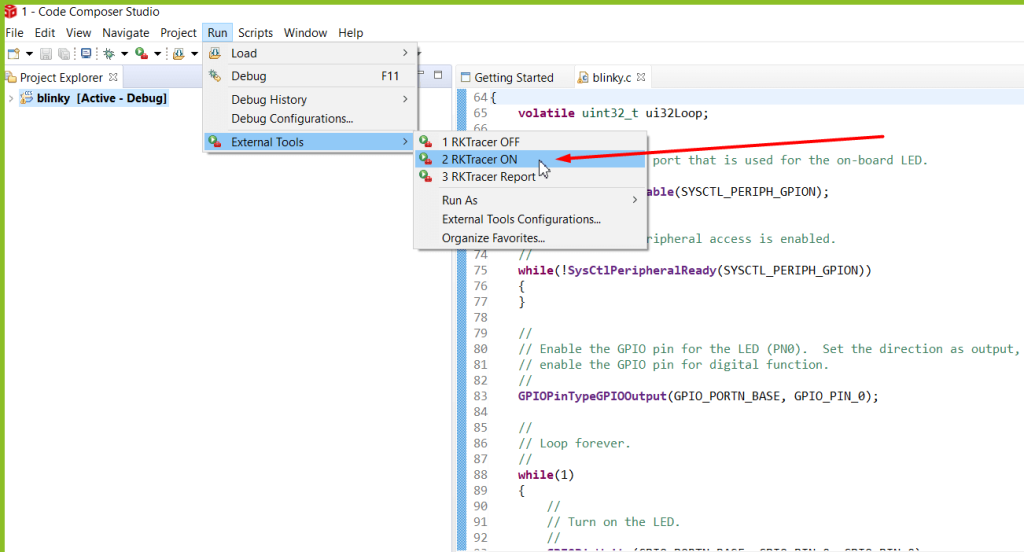
3: To enable or disable the RKTracer tool, you can go to
Run menu→ External tools to see RKTracer tool options.
- RKTracer ON: Will enable RKTracer tool for instrumentation
- RKTracer OFF: Will disable RKTracer tool.
- RKTracer Reports: Will generate reports in HTML format.
Generate Code Coverage for Embedded Application in Code Composer Studio IDE.
Prerequisites: Once you have successfully integrated the RKTracer tool. At least once you need to build and test the application in embedded target in debug mode and restart the IDE.
Enable Code Coverage Tool
- RKTracer ON: Will enable RKTracer tool for instrumentation
- RKTracer OFF: Will disable RKTracer tool.
- RKTracer Reports: Will generate reports in HTML format.
Go to → Run menu → External Tools → RKTracer ON.

Rebuild application and run tests
Clean and build the application to instrument with the RKTracer tool and run test cases in embedded target in debug mode or preferred method.
Saving coverage data.
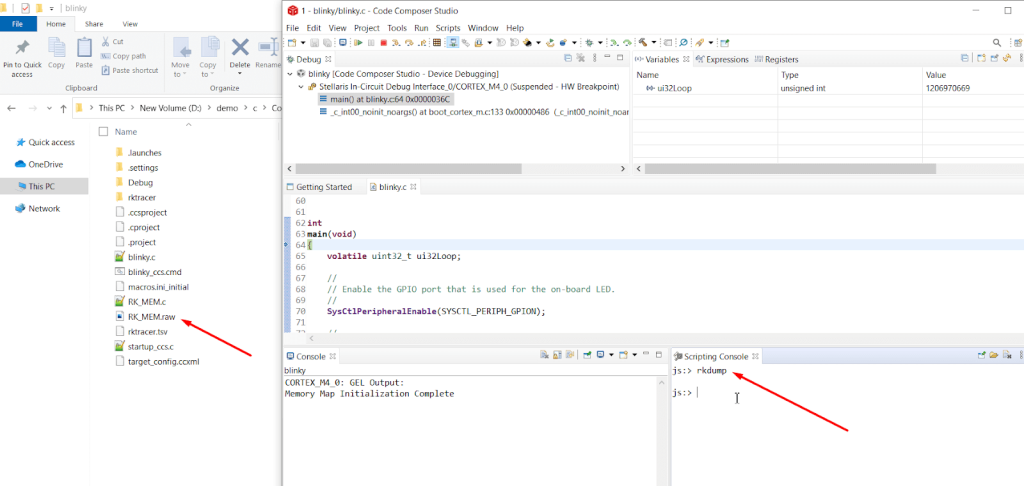
Once testing is completed, don’t exit from debug mode. To save the coverage data to build/host machine from the embedded target device.
goto View menu→ Scripting Console
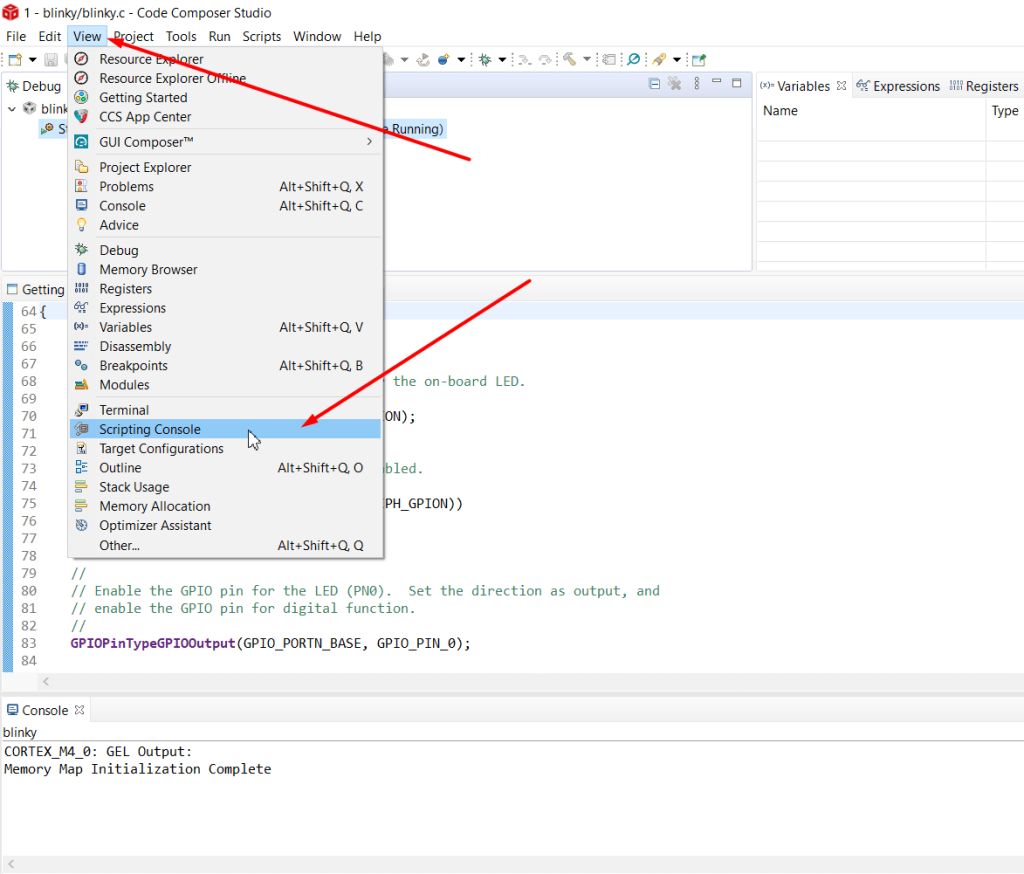
Now in Scripting Console, execute “rkdump” to save the coverage data to the project folder.
Generate Code Coverage Reports.
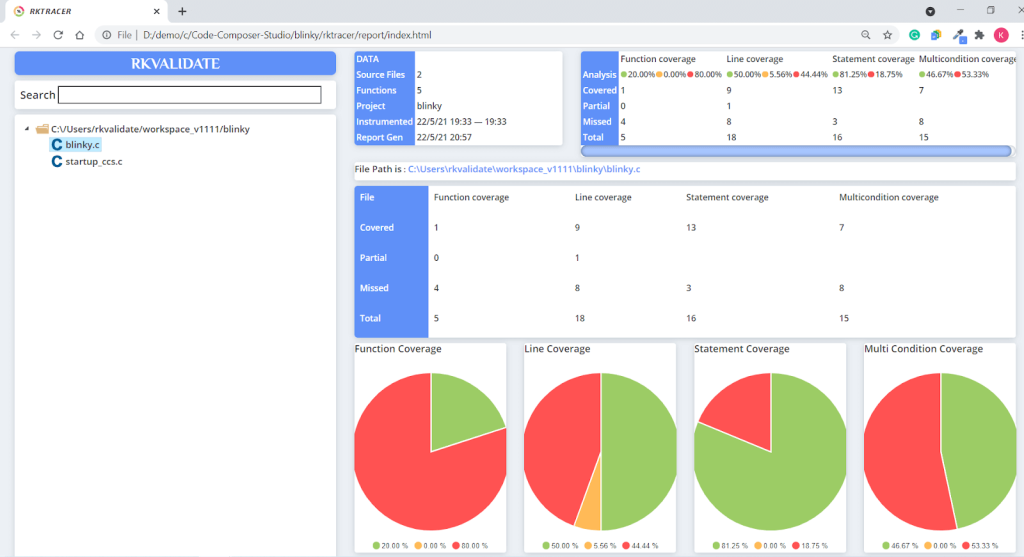
Go to –> Run menu –> External Tools –> RKTracer Report to generate Html reports. The RKTracer tool will internally convert the RK_MEM.raw data file to “rk-coverage.txt” and map with JSON files (generated during instrumentation) in the rktracer folder and generate the HTML reports. You can manually open the HTML report using index.html.
If embedded target is not connected to host ,then contact support. We will provide customized script to transfer coverage data from embedded target to host machine.
RKTracer Html code coverage landing page.
Enable coverage for selected files
Generate coverage reports for the selected folders
C:projectsounddriversbasepower
C:projectsounddriversbasepowerfirmware_loader
C:projectsounddriverscore
C:projectsoundsecuritykeys
C:projectsoundsecuritylockdown
Suppose you need code coverage for source files from three different folders, i.e., core, keys, power, and ignore coverage for folders firmware_loader and lockdown. Edit rktracer.config in the RKTracer installation folder and go to the end of the file add the following information.
ignore *.c
instrument */power/* */core/* */keys/*
never */firmware_loader/* */lockdown/*
ignore *.c = Ignores all C source files from instrumentation
Instrument = Instrument source files from given folders
never = ignore selected folder
Generate coverage reports only for selected functions from three different files.
fun_X() in source-file-X
fun_Y() in source-file-Y
fun_Z() in source-file-Z
Suppose you need code coverage for selected functions from three different files. Edit rktracer.config in the RKTracer installation folder and go to the end of the file and set the following variables as shown below.
ignore *.c
instrument *source-file-X.c *source-file-Y.c *source-file-Z.c
function-ignore *
function-instrument fun_X() fun_Y() fun_Z()
ignore *.c = Ignore all C programming source files
instrument *file-X.c *file-Y.c *file-Z.c = Instrument only these three source files.
function-ignore * = Then ignore all functions in the above three files.
function-instrument fun_X() fun_Y() fun_Z() = Don’t ignore these three functions from these three files from instrumentation